Friday 16 August 2013

Transaction and Distribution

What is SQL Server transaction?
A block of or single statements execute in the database in sequence ways perform all the statement   or none of them. A transaction must satisfy four properties
-          Atomicity
Transactions either commit or roll back  
-          Consistency
It should maintain the state data from start of transaction to the end of transaction.
-          Isolation
It should isolate the modification by the two transactions.
-          Durability
If any disaster occurred in the database before the transaction it rolled back all data otherwise it will store the data in place.

Begin Transaction | Tran trans1
-          Start point of transaction.
Commit Transaction trans1
-          Store the data permanently in the database.
Rollback Transaction trans1
-          Rolled back all the data from begin transaction statements.
Save Transaction trans1
-          Store the some part of transaction data in the database.

BEGIN TRAN T1;
UPDATE table1 ...;
BEGIN TRAN M2 WITH MARK;
UPDATE table2 ...;
SELECT * from table1;
COMMIT TRAN M2;
UPDATE table3 ...;
COMMIT TRAN T1;
MSDTC – Microsoft distribution transaction coordinator
Whenever do the operation on the multiple server that time need to use the distrinbuted trancation.

BEGIN DISTRIBUTED TRANSACTION;
-- Delete candidate from local instance.
DELETE AdventureWorks.HumanResources.JobCandidate
    WHERE JobCandidateID = 13;
-- Delete candidate from remote instance.
DELETE RemoteServer.AdventureWorks.HumanResources.JobCandidate
    WHERE JobCandidateID = 13;
COMMIT TRANSACTION;

How locking is intergrated with the ISOLATION Level

In SQL Server whenever multiple uses are trying to access the piece of data at the same moment locking mechanism provides the data in synchronies ways to all the uses. Specifically Locking mechanism is using in programs at the time of deal with isolation levels.
Locking is specifically integrated with the ISOLATION LEVEL.
Types of mode of Locking
-          Shared  (S)

Shared locks apply on the read (SELECT) operation. Whenever one transaction is reading the data on same moment other transaction cannot modify the data. Once read operation is completed shared lock released from the transaction.

-          Update (U)–

At a single moment only one transaction can modify the data. Other transaction still waits to complete the current transaction.

-          Exclusive(X) –

No other transaction can’t modify the data and read operation can be take place with the help of NOLOCK hints.

At the time of both the operation read and modify, first read operation access the data before performing the modification operation in exclusive lock.

-          Schema
-          Bulk update
-          Key range
-          Intent

Get the table data in the csv format file

select top 10 'exec master..xp_cmdshell'+ ' '''+ 'bcp'
+ ' ' + TABLE_CATALOG + '.' + TABLE_SCHEMA + '.' + TABLE_NAME + ' out'+ ' c:\Temp\'+ TABLE_CATALOG + '.' + TABLE_SCHEMA + '.' + TABLE_NAME + '.csv' + ' -c -t; -T -S' + @@servername+ ''''from INFORMATION_SCHEMA.TABLES where TABLE_TYPE = 'BASE TABLE'

Thursday 20 June 2013

2014 Announced and SQL Server 2014 Datasheet

Earlier this week Microsoft has announced SQL Server 2014. The release date of Trial of SQL Server to be believed later this year.
Here are few of the improvements which I was looking forward are there in this release. Please note this is not the exhaustive list of the features of SQL Server 2014. This is the a quick note on the features which I was looking forward and now will be available in this release.
  • Always On supports now 8 secondaries instead of 4
  • Online Indexing at partition level – this is a good thing as now index rebuilding can be done at a partition level
  • Statistics at the partition level – this will be a huge improvement in performance
  • In-Memory OLTP works by providing in-application memory storage for the most often used tables in SQL Server. 
  • Columnstore Index can be updated – I just can’t wait for this feature (Columnstore Index)
  • Resource Governor can control IO along with CPU and Memory
  • Increase performance by extending SQL Server in-memory buffer pool to SSDs
  • Backup to Azure Storage
You can additionally download SQL Server 2014 Datasheet from here. Which is your favorite new feature of SQL Server 2014?

Friday 1 March 2013

Cascading Parameters in SSRS 2008

Cascading parameters provide a way of managing large amounts of report data. You can define a set of related parameters so that the list of values for one parameter depends on the value chosen in another parameter. For example, the first parameter is independent and might present a list of product categories. When the user selects a category, the second parameter is dependent on the value of the first parameter. Its values are updated with a list of subcategories within the chosen category. When the user views the report, the values for both the category and subcategory parameters are used to filter report data.

In this post we will walk through the steps of building a report and with query parameters for both product category and subcategory items. Then we will develop individual datasets to provide values for the cascading parameters.

I will use AdventureWorks2008R2 database for this article. You can install this database from codeplex.

STEP 1:
Open your existing Report Server project or create a new Report Server project. Add a new report and rename it as CascadingParameters.rdl. Now create a Data Source for AdventureWorksDW2008R2 database. For more information about creating shared Data Source, Click Creating Shared Data Source in SSRS 2008.

STEP 2:
Create three data sets as mentioned below:

1. dsProductCategory: This Data Set will be used to create a parameter for Product Categories. Use below query for this data set:
SELECT ProductCategoryID,Name AS ProductCategory
FROM Production.ProductCategory (NOLOCK)
ORDER BY Name

 2. dsProductSubcategory: This Data Set will be used to create a Cascading Parameter for Product Subcategories. Use below stored procedure for this data set.

CREATE PROC procProductSubcategory
(
   @ProductCategoryID varchar(1000)
)
AS
BEGIN
   SELECT ProductSubcategoryID,Name AS ProductSubcategory
   FROM Production.ProductSubcategory (NOLOCK)
   WHERE ProductCategoryID IN (SELECT Value
   FROM [dbo].[SplitMultivaluedString](@ProductCategoryID,','))
   ORDER BY Name
END
-------- UNIT TESTING ------------------
-- EXEC procProductSubcategory '1'
-- EXEC procProductSubcategory '1,2'
-- EXEC procProductSubcategory '1,3'
----------------------------------------
GO

Note: Function SplitMultivaluedString is used to split comma seperated values of parameter @ProductCategoryID. Click Function to Split Multi-valued Parameters to get T-SQL script of this function.

Result of EXEC procProductSubcategory '1,3' is shown below:

3. dsProduct: This data set will give the list of all the products based on the Product SubCategories selected at run time. Use below stored procedure for this data set:

CREATE PROC procProductsList
(
   @ProductSubcategoryID varchar(1000)
)
AS
BEGIN
   SET NOCOUNT ON

   SELECT
      PC.Name ProductCategory
      ,PS.Name ProductSubcategory
      ,P.Name ProductName,ProductNumber
      ,Color,Size,[Weight]
   FROM Production.Product P (NOLOCK)
   INNER JOIN Production.ProductSubcategory PS
     ON PS.ProductSubcategoryID = P.ProductSubcategoryID
   INNER JOIN Production.ProductCategory PC
      ON PC.ProductCategoryID = PS.ProductCategoryID
   WHERE P.ProductSubcategoryID IN (SELECT Value
    FROM [dbo].[SplitMultivaluedString](@ProductSubcategoryID,','))
END
-- EXEC procProductsList '6,7,8,18,30,36'
GO

Result of EXEC procProductsList '6,7,8,18,30,36' is shown below:


STEP 3:
Once you create above data sets, you can see two parameters created automatically - ProductCategoryID and ProductSubcategoryID as shown below:
Now double click on parameter ProductCategoryID to open Report Parameter Properties window. In General, change the Prompt value as Product Category and check Allow multiple values checkbox. In Available Values, Select Get values from a query option and select dsProductCategory in Dataset, ProductCategoryID in Value field and ProductCategory in Label field. Now click on Default Values, Click on Get values from a query option and select dsProductCategory in Dataset, ProductCategoryID in Value field. Finally click OK to save changes.

Similarily change the properties of parameter ProductSubcategoryID. In General, change the Prompt value as Product Subcategory and check Allow multiple values checkbox. In Available Values, Select Get values from a query option and select dsProductSubcategory in Dataset, ProductSubcategoryID in Value field and ProductSubcategory in Label field. In Default Values, Click on Get values from a query option and select dsProductSubcategory in Dataset, ProductSubcategoryID in Value field.
Finally click OK to save changes.

STEP 4:
In report Design, drag and drop a table control and map with dsProduct data set. select all the columns from dsProduct in the tables and format this as shown below:


Thats all. We are done with a report having one cascading parameter. Click on Preview to view the report. Now you can see that values of Parameter Product Subcategory depends on the parameter Product Category. By Default, Product Category parameter has (Selected All) so Product Subcategory will also display all the values.

Values of Product Subcategory parameter will be filtered as per selection of the values of Product Category parameter, which will filter the actual report data because Product Subcategory parameter is used to filter report data.

SSIS Logging


In this article I'm writting about Logging features in SQL Server Integration Services (SSIS).

I'hv been using SSIS since last 6-7 years and I have had to implement Logging Mechanism in almost all the projects to track/debug the execution of each and every task/event used in the package. Some of you may say its pretty easy to implement - still I guess we need to take care of logging because some of the things are not so easy.

Integration Services includes logging features that write log entries whenever run-time events occur but the good thing is that it can also write custom messages. Also SSIS supports a diverse set of log providers that can write log entries to: Text files, SQL Server Profiler, SQL Server, Windows Event Log, or XML files.

My favourite log is SQL Sevrer because using sql table I can write my own queries to find logging info related to specific task/event or any failure easily.

Basically SSIS logs are associated with packages and are configured at the package level. The task(s)/container(s) in a package can be enabled for logging even if the package itself is not e.g enable logging on an Execute SQL task without enabling logging on the parent package. Also package/container/task can write to multiple logs. You can enable logging on the package only, however you can choose to enable logging on any individual task/container.

You can select a level of logging as per your requirement by specifying the events to log and the information to log for each event, however some events provide more useful information than others.

I'll explain Logging using SQL Server 2012.
Note: SSIS 2005 uses table sysDtsLog90 for logging and SSIS 2008 & SSIS 2012 use sysSSISLog table for logging.

Below is the description of each element in the log schema:

ElementDescription
ComputerThe name of the computer on which the log event occurred.
OperatorThe identity of the user who executed the package.
SourceThe name of the container or task in which the log event occurred.
SourceIDThe unique identifier of the package;
the For Loop, Foreach Loop, or Sequence container;
or the task in which the log event occurred.
ExecutionIDThe GUID of the package execution instance.
StartTimeThe time at which the container or task starts to run.
EndTimeThe time at which the container or task stops running.
DataCodeAn integer value from the DTSExecResult enumeration
that indicates the result of running task:
  • 0 - Success
  • 1 - Failure
  • 2 - Completed
  • 3 - Canceled
DataBytesA byte array specific to the log entry.
The meaning of this field varies by log entry.
MessageA message associated with the log entry.

The following table describes the predefined events that can be enabled to write log entries when run-time events occur:
EventsDescription
OnErrorWrites a log entry when an error occurs.
OnExecStatusChangedWrites a log entry when the execution status of the executable changes.
OnInformationWrites a log entry during the validation and execution of an executable to report information.
OnPostExecuteWrites a log entry immediately after the executable has finished running.
OnPostValidateWrites a log entry when the validation of the executable finishes.
OnPreExecuteWrites a log entry immediately before the executable runs.
OnPreValidateWrites a log entry when the validation of the executable starts.
OnProgressWrites a log entry when measurable progress is made by the executable.
OnQueryCancelWrites a log entry at any juncture in the task processing where it is feasible to cancel execution.
OnTaskFailedWrites a log entry when a task fails.
OnVariableValueChangedWrites a log entry when the value of a variable changes.
OnWarningWrites a log entry when a warning occurs.
PipelineComponentTimeFor each data flow component, writes a log entry for each phase of validation and execution. The log entry specifies the processing time for each phase.
DiagnosticWrites a log entry that provides diagnostic information e.g. you can log a message before and after every call to an external data provider.


Implementing Logging in SSIS 2012 
 To implement the SSIS logging, follow these steps:

 Step1. Create a Connection Manager for logging database. Right click on Connection Managers area and click on New OLE DB Connections... as shown below:


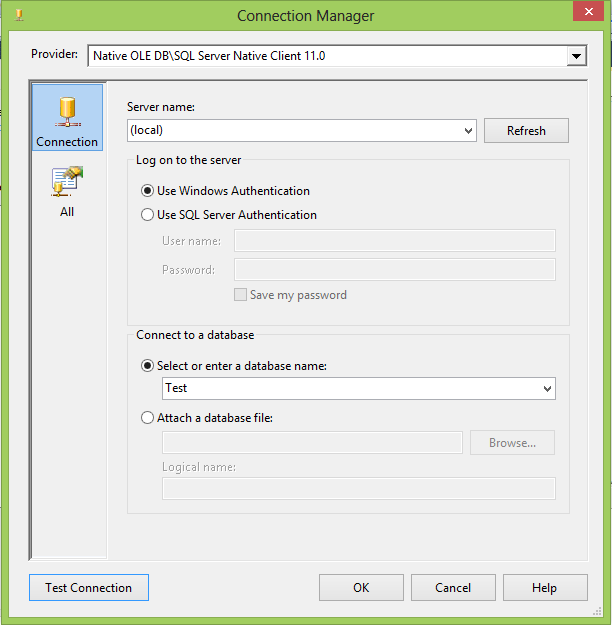
Step2. In the "Configure OLE DB Connection Manager" click on Create button. Now select Server Name and database name from Connect a database. I am using (Local) server and Test database. Click on Test Connection button to verify the connection.


Finally click on OK button to save the connection manager. This will create a new connection manage with ServerName.DatabaseName name. In my example, it is (local).Test. You can rename it to appropriate and meaningful name. For instance cmLogging.

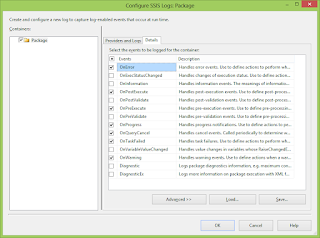
Step3. Right click anywhere on the package surface area in the Control Flow to open Configure SSIS Log: Package wizard.  Check the Package folder checkbox (left side) to enable the logging. Under the "Providers and Log" tab, select "SSIS log provider for SQL Server" in Provider type and click on Add button t add this logging for the package. Finally, click on Configuration to select the logging connection manager. Select cmLogging as connection manager.


Step4. Select logging events.
To prevent log files from using large amounts of disk space, which could degrade performance, you can limit logging by selecting specific events and information items to log. For example, you can configure a log to capture only the date and the computer name along with error message. It is not a good idea to log all the events. Under "Details" tab, select required events for logging:


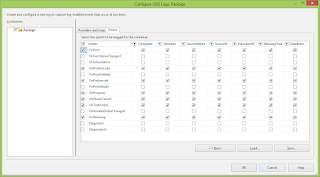
Step5. Click on Advance button to set advance properties of the logging events.

Finally click on the OK button to save logging configuration.

Step6. Now you can validate your logging information by executing the SSIS package. To get more information about hoe to execute SSIS package, click Different ways to Execute SSIS packages. My package looks like the picture shown below:
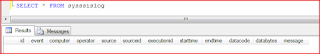
You can see the log in sysSSISLog table after executing the package.

SELECT * FROM Test.dbo.sysssislog


Thursday 28 February 2013

Key Performance Indicators (KPIs) using Analysis Services

In business terminology, a KPI is a quantifiable measurement for gauging business success. In Analysis Services, a KPI is a collection of calculations that are associated with a measure group in a cube that are used to evaluate business success. Typically, these calculations are a combination of Multidimensional Expressions (MDX) expressions or calculated members. KPIs also have additional metadata that provides information about how client applications should display the results of the KPI's calculations

Common KPI Terms:
  • Goal - An MDX numeric expression or a calculation that returns the target value of the KPI.
  • Value - An MDX numeric expression that returns the actual value of the KPI.
  • Status - An MDX expression that represents the state of the KPI at a specified point in time. The status MDX expression should return a normalized value between -1 and 1. Values equal to or less than -1 will be interpreted as "bad" or "low." A value of zero (0) is interpreted as "acceptable" or "medium." Values equal to or greater than 1 will be interpreted as "good" or "high."
  • Trend - An MDX expression that evaluates the value of the KPI over time. The trend can be any time-based criterion that is useful in a specific business context. The trend MDX expression enables a business user to determine whether the KPI is improving over time or degrading over time.
  • Status indicator - A visual element that provides a quick indication of the status for a KPI. 
  • Trend indicator - A visual element that provides a quick indication of the trend for a KPI. 
  • Display folder - The folder in which the KPI will appear when a user is browsing the cube.
  • Parent KPI - A reference to an existing KPI that uses the value of the child KPI as part of computation of the parent KPI. Sometimes, a single KPI will be a computation that consists of the values for other KPIs.
  • Weight - An MDX numeric expression that assigns a relative importance to a KPI. If the KPI is assigned to a parent KPI, the weight is used to proportionally adjust the results of the child KPI value when calculating the value of the parent KPI.
Creating KPIs using Business Intelligence Development Studio (BIDS)

  1. Click on the KPIs tab
  2. We shall first add a KPI named ProfitPercentage to the cube:
    • Click on the New KPI button or right-click on the KPI Organizer window and select New KPI.
    • In the KPI Designer which opens up, type in the name of the KPI as ProfitPercentage.
  3. Add the measure to the Sales Fact measure group by selecting from the Associated measure group drop down.
  4. Now let's add an expression to evaluate the value property of the KPI:
    • Type the following expression in the Value Expression box. You could also drag the measures from the Metadata tab in the Calculation tools window.
      [Measures].[Profit]/[Measures].[Product Cost]
      OR
      ([Measures].[Sales Amount]/[Measures].[Product Cost]-1
      We have built the expression above using the logic that ProfitPercentage is calculated as the difference in Sales and Cost, divided by the Cost.
      Here [Measures].[Profit] is Calculated Member using below calculation:
      CREATE MEMBER CURRENTCUBE.[MEASURES].[Profit]

      AS SUM
      (
      [Date].[Calendar Year - Qtr - Month].currentmember,
      [Measures].[Sales Amount]-[Measures].[Product Cost]
      ),
      FORMAT_STRING = "#,#",
      VISIBLE = 1;
  5. Now, let us set the goal of the KPI to a constant. Enter 0.25 in the Goal Expression box, which means the goal expects 25% more in sales than the cost.
  6. Next we are on to the all important status. Here we shall write an expression to compare the value with the goal: 
    • Before examining the actual expression let us take a look at a pseudo-expression:
      CASE
         WHEN value/goal >= 0.9 THEN 1
         WHEN value/goal < 0.8 THEN -1
         ELSE 0
      END

      Here, a ratio of .9 would be considered good in this instance. This means that if the value makes up at least 90% of the goal then it would be considered as successful, hence the value 1 to indicate it. If value/goal equals to less than 0.8 then the status will be considered as a failure (-1). And all those values do not fall into the above ranges will be considered neutral (0).

      Now, enter the following MDX expression into the Status expression box:
      CASE
         WHEN
      KPIValue("ProfitPercentage")/KPIGoal("ProfitPercentage")>=.9 THEN 1
         WHEN KPIValue("ProfitPercentage")/KPIGoal("ProfitPercentage")< .8 THEN -1
         ELSE
      0
      END


      Being the realization of the previous "pseudo-expression", the above expression replaces value with KPIValue("ProfitPercentage") and goal with KPIGoal("ProfitPercentage"). The KPIValue function returns the value of the KPI's value property, while the KPIGoal function returns the value of the KPI's goal property. Both functions take the name of the KPI through a character string parameter.
  7. Select an appropriate image type from the Status indicator drop down to provide for the visuals of the KPI status.
  8. The next property to be configured is the trend. Once again, let us first look at a "pseudo-expression":
    CASE
       WHEN IsEmpty(x) THEN 0
       WHEN v - vX >= 0.25 THEN 1
       WHEN v - vX < -0.1 THEN -1
       ELSE 0
    END

    Here, x is the current time period of the previous year. For instance if the current selected time period is 20-May-2008, x will be 20-May-2007. v is the value of the KPI, which by default would return the value for the current time period. vx is the value of the KPI for the same time period of the previous year. The expression first checks if x is empty, thereby resulting in 0 (or no change in trend). Then, it checks if the current period's value is an increase of at least 25%, thereby indicating 1 or a positive trend. If there's a decrease of more than 10% from last year it indicates a negative trend or -1. All other results will indicate no change in the trend (or 0).

    Enter the following MDX expression in the Trend expression textbox:
    CASE
    WHEN
    IsEmpty(ParallelPeriod([Date].[Calendar Year - Qtr – Month].[Calendar Year], 1,[Date].[Calendar Year - Qtr – Month].CurrentMember)) THEN 0
    WHEN KPIValue("ProfitPercentage")-(KPIValue("ProfitPercentage"), ParallelPeriod([Date].[Calendar Year - Qtr - Month].[Calendar Year],1,[Date].[Calendar Year - Qtr - Month].CurrentMember)) >= 0.25
    THEN 1
    WHEN KPIValue("ProfitPercentage") - KPIValue("ProfitPercentage"),
    ParallelPeriod([Date].[Calendar Year - Qtr - Month].[Calendar
    Year],1,[Date].[Calendar Year - Qtr - Month].CurrentMember)) < -0.1 THEN -1
    ELSE 0
    END

    In the MDX expression above, x is replaced by ParallelPeriod([Date].[Calendar Year - Qtr - Month].[Calendar Year], 1,[Date].[Calendar Year - Qtr - Month].CurrentMember) ParallelPeriod is a function which returns a member from a prior period in the same relative position as a specified member. The variable v is replaced by KPIValue("ProfitPercentage") and vx is replaced by (KPIValue("ProfitPercentage"), ParallelPeriod([Date].[Calendar Year - Qtr - Month].[Calendar Year], 1,[Date].[Calendar Year - Qtr - Month].CurrentMember)).
  9. Select an appropriate image type from the Trend indicator drop down to provide for the visual of the KPI trend. Here's a sample of what the KPI designer should look like:


10. The KPIs is done! Next, process the cube. You will be able to view the KPIs using the built-in KPI Browser under the KPIs tab in BIDS. You could also use Office 2007 Excel.